

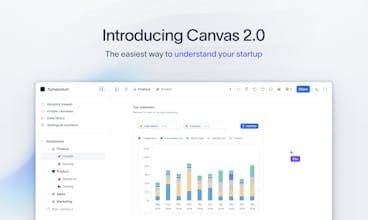

Product Information
What is Canvas-12?
Connect to all your data and understand your startup. Design beautiful dashboards. Use one of over 100 templates to manage runway, keep customers happy, and grow with confidence.
How to use Canvas-12?
Canvas is a data analysis and visualization tool designed to help startups connect, understand, and leverage all their data through beautiful dashboards and automation features, enabling data-driven decisions without coding.
Core Functions of Canvas-12
Connect 150+ SaaS tools and custom APIs
Design beautiful data dashboards
Provide expert-made startup metric templates
No-code data exploration and visualization
Supports Excel-like operations and pivot tables
Provide real-time business alert notifications
Usage Scenarios of Canvas-12
- Manage startup operational data
- Analyze customer behavior and satisfaction
- Monitor key business metrics (e.g., ARR, revenue, LTV)
- Integrate multi-source data for comprehensive analysis
- Collaborate with teams for data exploration
- Receive real-time business alerts
Common Questions about Canvas-12
What does Canvas do?
How do I use Canvas?
What are the core features of Canvas?
What are the use cases for Canvas?