


Product Information
What is Analytics 101?
Analytics 101 is a business intelligence and analytics platform that offers robust automation features to streamline data processing and enhance efficiency. Key functionalities of Analytics 101 include:
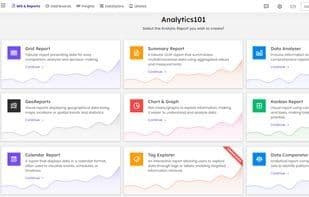
- **Grid Reports** provide a structured way to display data, organizing it into spreadsheets (e.g., Excel-like formats).
- **Summary Reports** enable interactive analysis and exploration of multidimensional data.
- **Data Analyzer** transforms raw data into actionable insights through visual representations of trends, patterns, and relationships.
- **Geographic Reports** are designed for spatial data analysis and location-based intelligence.
- **Charts and Graphs** visually represent data to simplify understanding and interpretation of complex information.
- **Real-time data updates** and live database connections ensure access to the most current information.
- The platform allows connectivity to various data sources, including Excel, SQL databases, and cloud platforms, for consolidating and analyzing data.
- Advanced analytics capabilities, predictive modeling, and statistical functions help identify trends, patterns, and outliers in data to support data-driven decision-making.
Analytics 101 is a leading business analytics platform that turns raw data into actionable insights. It caters to both experienced analysts and business owners, offering intuitive, interactive, and visually engaging dashboards.
How to use Analytics 101?
Analytics 101 is a business intelligence and analytics platform that streamlines data processing with robust automation, enhances efficiency, and transforms raw data into actionable insights.
Core Functions of Analytics 101
Lightweight
Ad-Free
Real-time collaboration
No Coding Required
Predictive modeling
Data Visualization
Usage Scenarios of Analytics 101
- Display and organize data structurally, such as in spreadsheet-like rows and columns.
- Perform interactive analysis and exploration of multidimensional data.
- Transform raw data into actionable insights through visualization, revealing trends, patterns, and relationships.
- Conduct spatial data analysis and location-based intelligence.
- Present data intuitively using charts and graphs for easy understanding and interpretation of complex information.
- Leverage advanced analytics, predictive modeling, and statistical capabilities to identify trends, patterns, and outliers in data, supporting data-driven decisions.
Common Questions about Analytics 101
What does Analytics 101 do?
How do I use Analytics 101?
What are the core features of Analytics 101?
What are the use cases for Analytics 101?