



Product Information
What is Sierra chart?
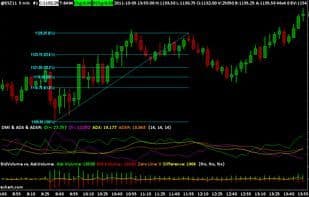
Sierra Chart is a professional trading platform for financial markets, supporting manual, automated, and simulated trading. It serves as a comprehensive real-time and historical charting and technical analysis platform with robust analytical capabilities for financial markets. Sierra Chart fully supports open-standard data and trading communication protocols from the community.
It offers optional high-quality direct real-time market data feeds covering U.S., European, Asian, and Canadian futures exchanges, as well as U.S., European, and Canadian stock exchanges and U.S. cash indices. Sierra Chart supports all types of markets: stocks, futures, indices, forex/currencies, and options.
Complete trading support, both basic and advanced, is provided, including user-friendly automated trading. Its exclusive Market Depth charting feature is fully integrated with the trading DOM (Depth of Market). Sierra Chart is compatible with numerous internal and external data and trading services, supporting all major data services and backend trading platforms.
With DTC (Data and Trading Communication) support, Sierra Chart automatically integrates with any external data or trading service using this protocol. Where possible, it utilizes FIX and DTC protocols for the most reliable and seamless trading experience.
Getting started with Sierra Chart is easy, and its intuitive design makes it simple to use. Download it and see for yourself—it’s well-organized, ensuring all features are easily accessible. Yet, it offers the functionality and flexibility demanded by advanced users.
You can create custom studies, indicators, and trading systems using Sierra Chart’s advanced custom research interface and scripting language or its built-in Excel-compatible spreadsheet. Alternatively, leverage those developed by Sierra Chart users and third-party developers.
Market Depth historical charting allows displaying historical market depth data directly on charts.
Stable and consistent in design, its existing features and interfaces remain uniform across versions.
How to use Sierra chart?
Sierra Chart is a professional financial market trading platform offering real-time and historical charts, technical analysis, and manual, automated, and simulated trading, providing powerful analysis tools and reliable trading support.
Core Functions of Sierra chart
Multi-Currency Support
Ad-Free
Portable
Futures Trading
Trading platform
Foreign exchange
Usage Scenarios of Sierra chart
- Perform manual, automated, or simulated trading.
- Conduct real-time and historical chart analysis and technical analysis of financial markets.
- Trade in various markets such as stocks, futures, indices, forex, and options.
- Create custom studies, indicators, and trading systems.
- Display historical market depth data on charts.
- Perform chart analysis and trading in cryptocurrency markets.
Common Questions about Sierra chart
What does Sierra Chart do?
How do I use Sierra Chart?
What are the core features of Sierra Chart?
What are the use cases for Sierra Chart?