



Product Information
What is Myresources?
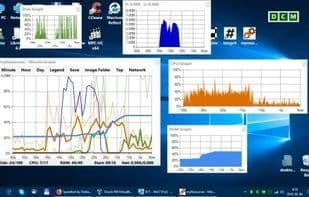
myResources displays the load status of basic computer resources (disk, CPU, memory, network) using graphs and activity icons. The program also features the ability to show resources on a combined graph (SumGraph), offering an informative and engaging way to monitor your computer's internal processes.
Activity icons with adjustable colors provide information about the current state. Clicking on a resource icon will display its associated graph, showing values from the last 30 seconds, updated every 0.1 seconds.
The activity icons reside in the system tray, and their appearance can be customized. There's a special "All in One" icon that displays the combined instantaneous state of resources using the color of the most heavily loaded resource. An icon panel can also be displayed, which can be moved to any position on the screen.
All activity icons and panels are displayed when you first start the machine or after a reset operation. Icon colors can be customized via the icon color settings. Icons can display a range of 0-100% in 10 levels, with a customizable color scheme for each level.
The SumGraph can be launched from the context menu or by using the "All in One" icon. It presents the load status of disk, CPU, and memory over the last minute, hour, or day in a single graph. A thick line indicates the current average, while a thin line shows the maximum values.
The 1-minute resolution graph also offers the option to display network traffic, which can be activated from the network menu. The maximum value on the network graph corresponds to the highest displayed interval value and is automatically scaled.
At the bottom of the SumGraph, numerical values show the average and maximum resource loads at 1-second resolution, the program's uptime, and the data transfer rate of the network.
How to use Myresources?
myResources displays the load status of basic computer resources (disk, CPU, memory, network) through charts and activity icons, offering intuitive monitoring via merged charts (SumGraph) to help users understand internal processes.
Core Functions of Myresources
Performance monitoring
Usage Scenarios of Myresources
- Monitor Disk, CPU, Memory, and Network Load in Real-Time.
- Quickly Check Resource Status via System Tray Icons.
- Customize Icon Colors to Reflect Load Levels.
- Use 'All in One' Icon for Overall Resource Load Overview.
- Analyze Long-Term (Minute/Hour/Day) Trends with SumGraph for Disk, CPU, and Memory.
- Track Network Traffic in 1-Minute Resolution Charts.
Common Questions about Myresources
What does myResources do?
How do I use myResources?
What are the core features of myResources?
What are the use cases for myResources?