


Product Information
What is Mermaid Charts?
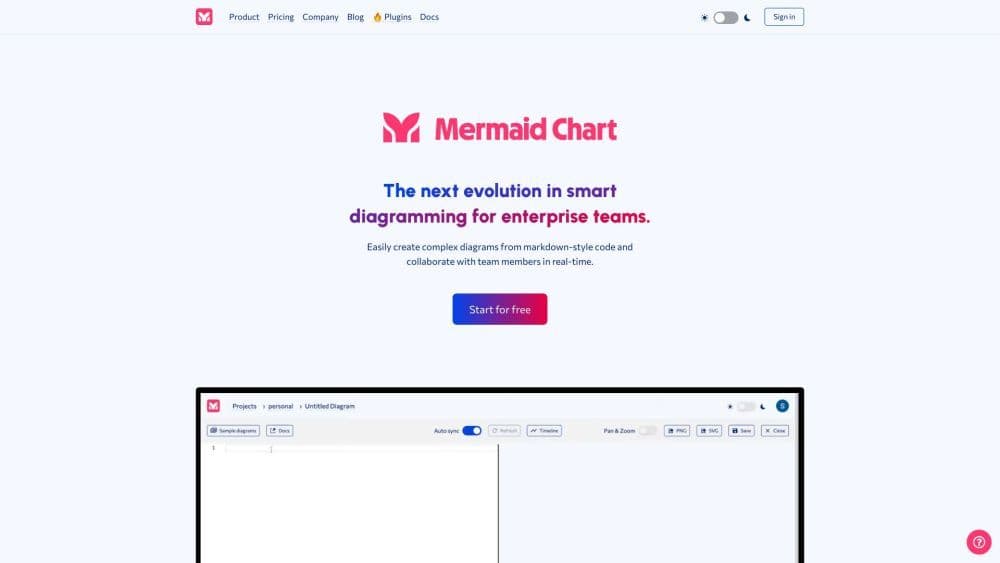
The Mermaid Chart is a collaborative text-to-diagram platform powered by the Mermaid open-source project (which has garnered 61k stars on GitHub). It streamlines code documentation, enhances team workflows, and leverages artificial intelligence to generate visualizations of complex ideas.
How to use Mermaid Charts?
To use Mermaid charts, simply register an account on the website. Once logged in, you can start creating charts using text-based formatting. The platform will automatically convert your text into real-time visualizations.
Core Functions of Mermaid Charts
Collaborative Diagramming
Text-Based Formatting
Real-Time Conversion
Code Documentation
Enhanced Team Workflows
AI-Powered Visualization
Usage Scenarios of Mermaid Charts
- Software Development
- System Architecture Design
- Business process modeling
- Data Flow Diagram
- Network Infrastructure Planning
Common Questions about Mermaid Charts
What is Mermaid Chart?
How does Mermaid Chart work?
What are the core features of Mermaid Chart?
What are some common use cases for Mermaid Chart?