



Product Information
What is Netgraph?
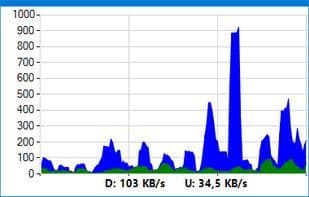
NetGraph is a free-to-use network bandwidth monitor. It displays real-time information about the state of network traffic in a visual format chosen by the user. NetGraph can monitor data flow for wired, Wi-Fi, and mobile broadband connections, as well as local networks and the internet.
The program's unique features include multiple types of display modes and an active tray icon. By appropriately selecting and configuring these, users can always access the most network information without interfering with the display of other applications.
In the case of graphical representations, the sampling frequency can be selected, and the limit values for the displayed graphs or progress indicators can also be set. A distinctive feature is the option to set the input average level, which significantly enhances the program's user experience and enables efficient display.
How to use Netgraph?
NetGraph is a free network bandwidth monitoring tool that displays real-time network traffic status in a user-selected visual format, helping users intuitively understand and monitor network data flow.
Core Functions of Netgraph
Portable
Traffic monitoring
Internet speed test
Usage Scenarios of Netgraph
- Monitor data flow on wired connections.
- Monitor data flow on Wi-Fi connections.
- Monitor data flow on mobile broadband connections.
- View real-time traffic status for local networks and the internet.
- Access network information without disrupting other programs via custom display modes and tray icons.
- Adjust sampling frequency and display limit values for graphical representations.
Common Questions about Netgraph
What does NetGraph do?
How do I use NetGraph?
What are the core features of NetGraph?
What are the use cases for NetGraph?